Have you ever heard of the term ABC analysis? You probably have. Here is everything you need to know about ABC analysis.

What is ABC analysis? Definition & history
Before diving into the main concept, let us take a quick history tour and understand the roots of this analysis method. In the 19th century, an Italian engineer and economist Vilfredo Pareto discovered that 80% of England’s total wealth belonged to just 20% of its population. Thus was developed the Pareto principle, which assumes that in many cases, nearly 80% of consequences originate from only 20% of causes.
Now, back to our topic. What does this have to do with inventory management and ABC analytics? ABC analysis is an inventory categorization strategy. It divides items into categories based on their perceived importance. The Pareto rule is vital for the supply chain to implement sales analytics. It helps to identify what aspect(s) of your business brings you more profit and therefore needs more time and attention to be spent on. Let us take the example of a store or a supermarket to visualize the concept better.
Example
Suppose we implement the Pareto theory on the example of a supermarket. In that case, we will assume that over 80% of our supermarket’s whole revenue originates from only 20% of our offerings. When we divide resources depending on their importance, we segment them as A, B, and C.
Category A includes all the top performer products with high annual consumption. Products that bring the most revenue to your business, in this case, supermarkets. These are the 20% offerings of the theory. Category C presents the low-revenue product categories, the slow movers, and the rarely sold items. And then, we have Category B, which includes the products and items with medium consumption value. Products in segment B generate somewhat revenue but mainly include products that are not in high daily demand.
Benefits of ABC analysis
Improved Item life-cycle management
Every product you hold in your offerings has an estimated life cycle in your business. It is either a newly launched product, growing, at its maturity, or declining. It is essential to segment your products by performance to understand better which items demand more stock investments.
Better inventory optimization
When you understand which items are in demand and provide profit, optimizing space and dividing stock investments for each segment is easier. Of course sometimes such data is hard to put on one channel, and we recommend you an automated solution to inventory management, eSwap, where you can track all your sales data drom different sales channels in one place.
Improved supplier negotiations
The fact that you now possess the information of which suppliers provide you with the most profitable products gives you the opportunity for better negotiations with those suppliers. Since you know their products are in demand and you will continuously purchase them, you try negotiating with the suppliers for lower costs or other bargains.
Increased accuracy of sales forecasting
Product classification is also beneficial in the sense of a more vivid sales forecasting of your business. The more accurate your possessed information on customer demand/company supply correlation, the more your idea of increasing overall sales and revenue.
Strategic pricing
When you see that certain products are in high demand, you can implement strategic pricing, in this case control your pricing. Perhaps, you can higher Class A product prices, increasing company profits.
Improved resource allocation
Using this categorization strategy is also beneficial for resource allocation: planning your resource usage. These can be human resources, for instance. You need to align your customer demands with what you are offering. Strategically locate your personnel, efforts, and time according to your customer demands.
Improved storage management
Another benefit that this system carries is improved storage management through the analysis results. Meaning you can now efficiently provide adequate storage to each segment judging by their performance. If certain inventory items perform poorly, they should not take additional storage, resulting in excess inventory costs.
Indeed the system has many benefits, but there are limitations to it too. Perhaps the most problematic restriction of the ABC analysis is its narrow consideration of patterns. Indeed, it comes down to profit in the end; however, there are many factors that the system fails to take into consideration—for instance, seasonal demand. A product might not be highly demanded in summer, but it can be a significant profit generator in winter. The ill considerations of such essential factors have sometimes led to supplier partnership losses.
Calculations of ABC analysis
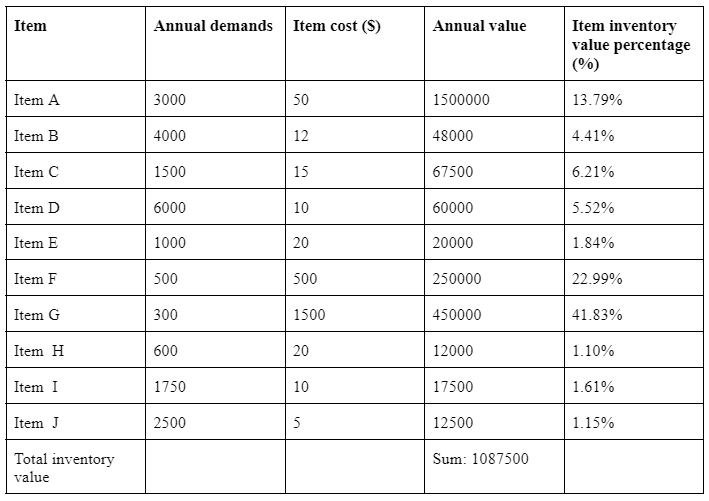
Suppose you want to conduct an ABC analysis for your business. In that case, you should collect the data on each item’s annual demand (amount of times it was purchased throughout the year) and the item costs.
Item Value = demands x cost
Total inventory value = sum of all Item Values
Calculate the percentage of each inventory value = item value / total inventory value x 100%
Here is a step by step example of such calculation:

You need to classify items into segments. For this, you need to line all items or products from least to most value of item inventory percentage. In the above example, we see that Item G has generated the most profit for that year, so it is a Class A product. When the company has the percentages of each item, it is up to the company to decide their classification standards.
It is crucial to understand that while some businesses use this analytics method, others have a much more thorough and complex calculation method due to their broad segmentation and size.
Final Thoughts
Though some aspects might be neglected using this method, ABC analysis is still a valid way to decrease any obstacles you might face throughout the inventory management process. It is a great tool to measure and control your pricing and improve your customer service.


