When a fast-growing seller says they have a reporting problem, they usually have an operations problem. Orders are coming from multiple channels, inventory lives in more than one warehouse, shipping costs are rising, and nobody trusts the numbers because each system shows a different version of the business. That is where ecommerce analytics dashboard software earns its place. It should not just show charts. It should give operators a clear, current view of what is selling, what is delayed, what is running out, and where margin is slipping.

For multichannel merchants, analytics is only useful when it reflects the real flow of inventory, orders, purchasing, fulfillment, and returns. A dashboard that looks polished but sits on top of fragmented data does not solve much. It just helps teams spot problems after they have already cost money.
What ecommerce analytics dashboard software should actually do
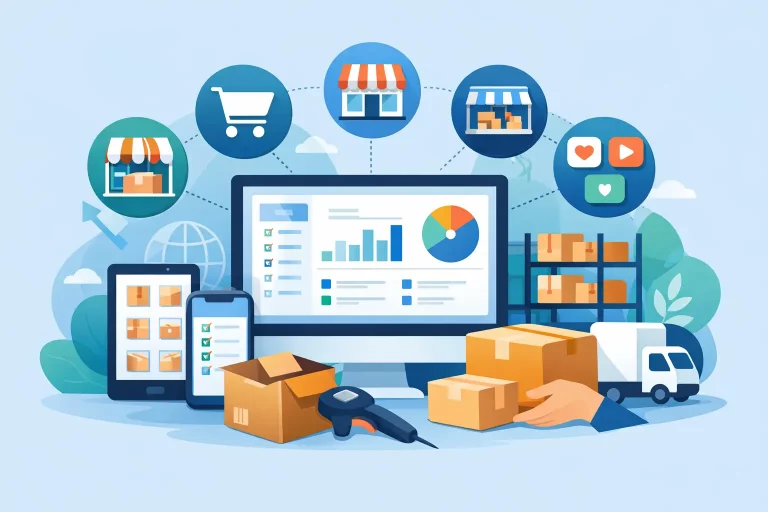
A serious commerce business needs more than a marketing dashboard and more than a basic sales report inside a storefront platform. The right system should pull operational data into one view so teams can make decisions without switching between marketplaces, shipping tools, spreadsheets, warehouse systems, and accounting exports.
At a practical level, that means showing live sales activity by channel, current inventory by location, order status by fulfillment stage, purchasing needs based on stock movement, and shipping performance against cost and speed. For growing sellers, those metrics are connected. If inventory is inaccurate, sales reporting becomes misleading. If warehouse delays are hidden, customer service pressure rises before leadership sees the issue. If channel performance is measured without landed cost or fulfillment cost, the business can scale the wrong products.
This is why ecommerce analytics dashboard software works best when it is tied to operations, not isolated from it.
The difference between reporting tools and operational dashboards
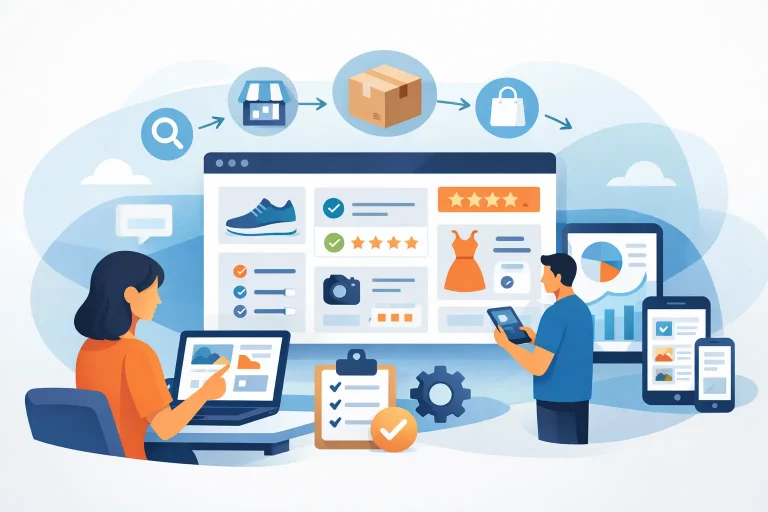
Many teams start with reporting apps that answer narrow questions. Which channel drove the most revenue last week? Which campaign converted best? Those tools have value, especially for marketing teams. But operators usually need a different layer of visibility.
An operational dashboard helps answer tougher questions. Which SKUs are about to oversell across Amazon, Shopify, and Walmart? Which warehouse is creating the most pick delays? Which orders are stuck in exception status? Which products are selling quickly but losing margin because shipping cost changed? Which suppliers need a purchase order now, not next week?
That distinction matters because revenue reporting alone can hide operational risk. A top-selling SKU may look healthy until you see split shipments, backorders, and cancellation rates attached to it. A channel may appear efficient until you break out fulfillment cost and return rate. Good software gives context, not just totals.
The metrics that matter most for scaling sellers
Not every merchant needs the same dashboard layout, but most scaling ecommerce teams need visibility into the same core areas.
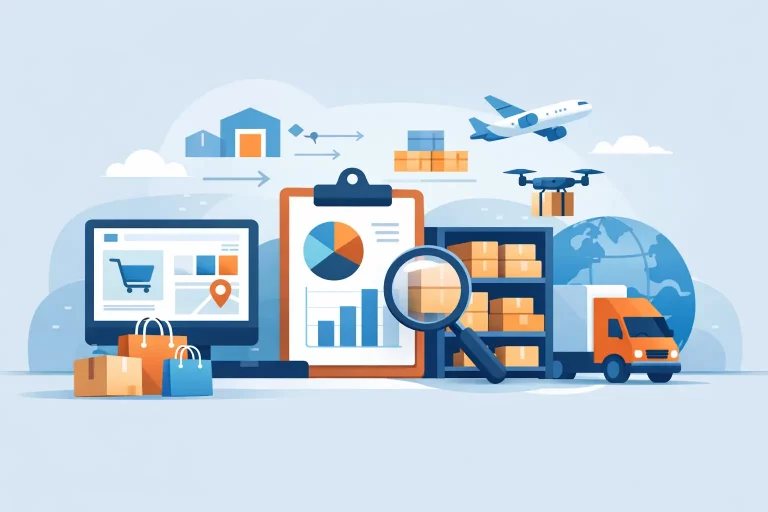
Sales performance is the obvious starting point, but it should be segmented by channel, SKU, brand, warehouse, and time period so patterns are usable. Inventory health is just as important. That includes available stock, committed stock, incoming stock, days of cover, stock aging, and low-stock risk. Without those numbers in one place, purchasing turns reactive.
Order flow metrics are often where hidden inefficiencies show up first. Teams should be able to see unshipped orders, average time to pick and pack, exception queues, cancellation trends, and fulfillment backlog by channel or warehouse. Shipping analytics should cover carrier mix, service-level performance, delivery speed, shipping cost by order profile, and where surcharge pressure is rising.
Margin visibility also needs more attention than many businesses give it. Revenue is easy to celebrate, but operators need to know what remains after marketplace fees, shipping cost, discounts, and product cost. If a dashboard cannot help identify profitable growth versus expensive growth, it is missing a major piece of the job.
Why disconnected data creates expensive decisions
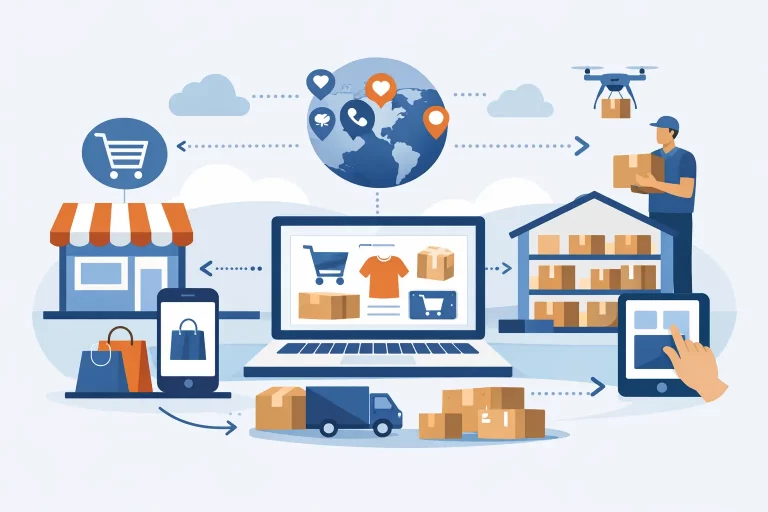
Fragmentation is the main reason dashboards fail. A retailer might use one system for marketplace orders, another for warehouse tasks, a separate shipping platform, and spreadsheets for purchasing. Each tool may be useful on its own, but once data is split across them, reporting becomes slower and less reliable.
The cost is not only time spent compiling reports. The bigger cost is decision quality. Teams reorder late because incoming inventory is not visible. They approve promotions without understanding stock position. They miss fulfillment bottlenecks because warehouse status is detached from order demand. They keep adding labor to solve issues that are really caused by poor system visibility.
This is why many sellers outgrow point analytics tools. They need a dashboard built on the same operational system that manages stock, orders, shipping, and replenishment. When the source of truth is unified, the analytics become more trustworthy and more useful in real time.

How to evaluate ecommerce analytics dashboard software
The strongest way to evaluate software is to start with operational decisions, not feature checklists. Ask what your team needs to act on every day. If the answer includes inventory allocation, order prioritization, purchasing timing, warehouse throughput, and multichannel performance, the dashboard needs to support those workflows directly.
Integration depth matters more than surface-level connectivity. A platform that says it connects to marketplaces and carriers is not enough. You need to know whether it syncs inventory accurately, updates order statuses reliably, tracks warehouse movement, and reflects shipping data in a way that can actually be analyzed.
Data freshness matters too. A dashboard updated once or twice a day may work for executive reporting, but it is weak for high-volume operations. Sellers managing live stock across several channels need near real-time visibility to avoid overselling and service failures.
Customization is another factor, but it should be practical. Teams should be able to organize views around the metrics that match their role. An owner may care about revenue, margin, and purchasing exposure. A warehouse lead may need open picks, aging orders, and carrier cutoff risk. A one-size-fits-all dashboard often creates noise.
Finally, look for software that connects analytics to action. Seeing a low-stock warning is useful. Being able to trigger replenishment planning from the same environment is better. Seeing delayed orders is important. Being able to trace them to a warehouse queue, shipping rule, or inventory exception is what saves time.
Where the best software creates real operational gains
The most valuable dashboards reduce reaction time. Instead of learning about problems after a customer complaint or an end-of-month review, teams can spot issues while there is still time to fix them.
That changes daily operations in measurable ways. Inventory accuracy improves because stock movement is visible across channels and locations. Fulfillment gets faster because backlog and exception points are easier to identify. Purchasing becomes more disciplined because demand signals and inventory position are connected. Leadership gains confidence because reporting comes from one system rather than stitched-together spreadsheets.
For warehouse-driven merchants and wholesalers, this becomes even more important. Complexity rises quickly once you add B2B orders, multiple fulfillment paths, channel-specific listing rules, and supplier lead times. Basic analytics tools are usually not built for that environment. They can report sales, but they struggle to reflect the operational chain behind those sales.
A platform such as eSwap fits this need best when the business requires more than reporting and needs centralized control over inventory, orders, shipping, warehouse workflows, purchasing, and multichannel activity in one place. In that setup, analytics is not a separate layer. It is part of how the business runs.
Common trade-offs to keep in mind
There is no perfect dashboard for every seller. Simpler tools can be easier to adopt, but they often cap out once channel count, SKU count, or warehouse complexity increases. More capable systems can require tighter process discipline, cleaner product data, and a more deliberate setup. That is a reasonable trade if the business is already feeling the cost of manual workarounds.
It also depends on who will use the dashboard. If leadership only needs top-line reporting, a lighter tool may seem sufficient. If operations, inventory planning, customer service, and fulfillment all need the same source of truth, the software has to do much more.
That is the real test. Good ecommerce analytics dashboard software does not just explain what happened. It helps teams control what happens next. For sellers trying to grow without adding chaos, that is the difference between a dashboard people glance at and a system the business can actually run on.